Uniswap Overview
Uniswap v2 Pools See Decline on Layer 2 Networks
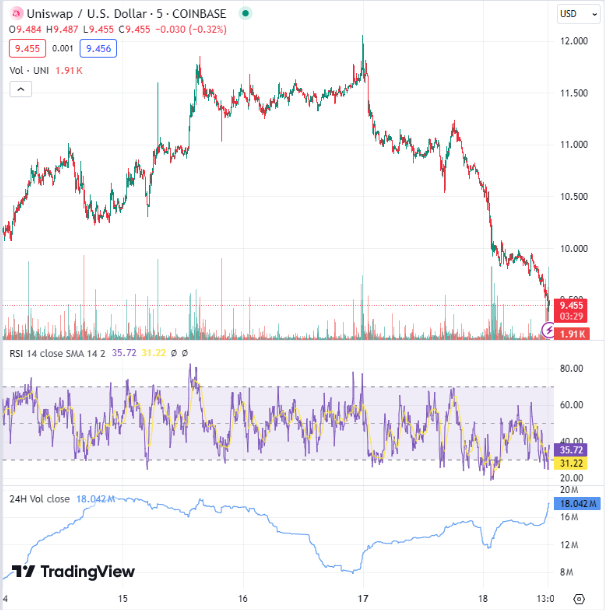
As Ethereum's Layer 2 (L2) solutions gain traction due to lower transaction fees, Uniswap v2 pools have become more popular than those on the Ethereum mainnet. This shift is particularly evident on Base, Coinbase's L2 solution, which accounts for over 95% of all L2 transactions. Uniswap's expansion to L2 platforms such as Optimism, Arbitrum, and Polygon, announced in February, is a key driver of this trend. Despite these advancements, UNI is currently trading at $9.49, down 14% in the last day with a 47% drop in trading volume.
Uniswap Attracts Bullish Interest
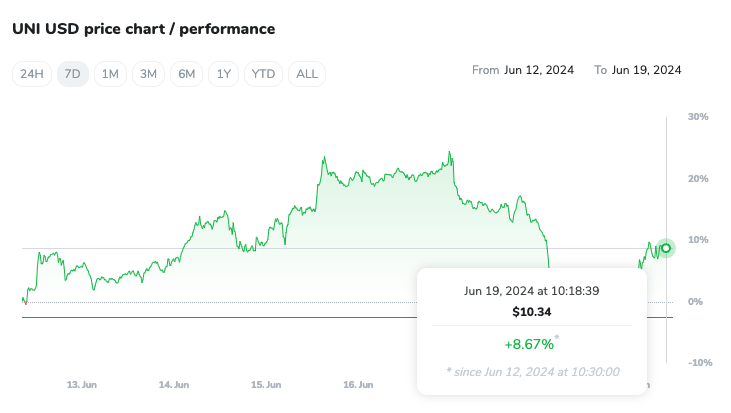
Uniswap has recently outperformed other top 20 crypto assets by market cap in short-term recovery. While other assets saw gains between 0.5% and 2%, UNI surged over 8%, breaking past the $10 resistance level to trade at $10.33. Over the past week, Uniswap gained 8.23%, and in the last 30 days, it saw over 50% inflows, highlighting strong bullish momentum. UNI’s market cap is currently $7.9 billion, with a trading volume increase of 3% above $378 million. Although it remains 74% below its all-time high of $44 during the 2021 bull run, recent whale activity, including a $20 million purchase by Amber Group, suggests continued upward pressure.


Technical Analysis of Uniswap (UNI)
Uniswap has experienced significant price movement, with a 16% increase in a single day, following a consolidation period between $6.92 and $8.40. Over the past month, UNI has climbed 31.02%. Currently priced at $10.33 with a market cap of $7.9 billion, it faces resistance at $11.6.
Despite this upward trend, UNI is encountering resistance near $12 and has retraced more than 13%. On-chain data shows increasing supply on exchanges, suggesting a potential local top. Technical indicators such as the Relative Strength Index (RSI) and the Awesome Oscillator (AO) exhibit bearish divergence, indicating a possible price downturn. The RSI’s lower high compared to UNI’s higher high on June 16 typically signals trend reversal or short-term correction.

On-chain metrics further support the bearish outlook. The supply of UNI on exchanges increased from 67.66 million on June 15 to 68.89 million on June 17, a 2% rise, indicating potential profit-taking. Development activity, tracked by Santiment, dropped from 95.14 to 90.34 in the same period, raising concerns about ongoing project innovation and engagement.
If UNI closes above $12, this bearish thesis would be invalidated, potentially rallying to $14. However, failure to maintain above the $10 level could lead to a drop to support levels of $9.06 and $7.0.
Uniswap’s Market Position and Future Prospects
Uniswap continues to play a critical role in decentralised finance (DeFi), offering a decentralised exchange protocol on the Ethereum blockchain. As of the latest data, UNI is priced at $10.33, reflecting a 4% increase in the past 24 hours, with a market cap of $7.9 billion and a circulating supply of 599,957,295 UNI tokens.
Launched in November 2018, Uniswap has evolved with V2 and V3 iterations, enhancing liquidity and trading efficiency without traditional order books. UNI token holders participate in governance, shaping the platform's future.
Uniswap's price prediction for 2024 hinges on key technical indicators such as Relative Volume (RVOL), Moving Average (MA), RSI, Average Directional Index (ADX), and Relative Volatility Index (RVI). These indicators suggest potential resistance at $11.87, with support at $7.00, signalling critical thresholds for future price movements.
Comparatively, Uniswap's price movements are closely tied to Bitcoin (BTC) and Ethereum (ETH), reflecting broader market trends. As BTC and ETH fluctuate, Uniswap often mirrors these changes, underscoring its interconnectedness within the crypto ecosystem. As the market evolves, Uniswap’s role in DeFi and its price trajectory will be closely watched by investors and analysts alike.

